
Russell 3000. These Chart Help Us Understand...
- Lester Davids
- 2 days ago
- 1 min read
The Russell 3000 Index (three thousand) measures the performance of 3,000 stocks and includes all large-cap, mid-cap and small-cap US equities, along with some microcap stocks. The index is designed to represent approximately 98% of investable US equities by market capitalization. In this note we consider the index breadth readings i.e. the percentage of shares above the 200, 50, 20 and 5-day moving averages. This helps us understand the breadth of the sell-off and whether the current readings is comparable to that of or (near) previous bottoms.
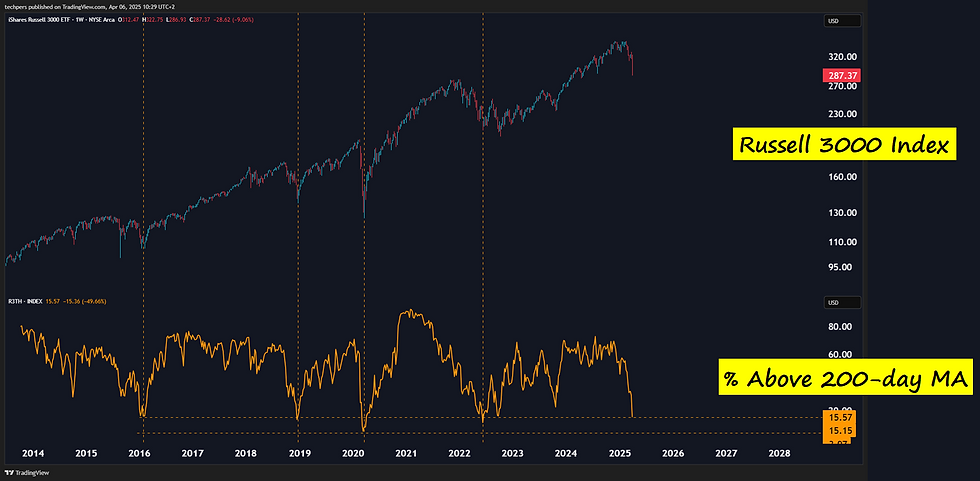
% of Shares Above The 200-day Moving Average = 15.57%
% of Shares Above The 50-day Moving Average = 7.41%
% of Shares Above The 20-day Moving Average = 5.37%
% of Shares Above The 5-day Moving Average = 2.44%

The chart below highlights two items:(1) the Russell 3000 index (upper panel) and (2) the % of shares above their 200-day moving averages. Here, we also highlight the index lows over the past decade vs the low in the breadth (% vs 200-day). At current levels, the percentage of shares above their 200-day moving averages is 15.57% which is near the low. It's worth noting that in March 2020 the percentage of shares above their 200-day moving averages was just below 5% which indicates that breadth has the ability to further deteriorate from current levels.
Lester Davids
Analyst: Unum Capital
Comments