Zooming out by using WEEKLY and MONTHLY CHARTS can provide immense value to investors taking a portfolio approach, with a long term time horizon.
Whilst we focus primarily on short term term trading opportunities, our research has taken the opportunity to identify risks as well as opportunities.
GLENCORE AND SIBANYE STILLWATER are two example of how we help our clients to manage risks.
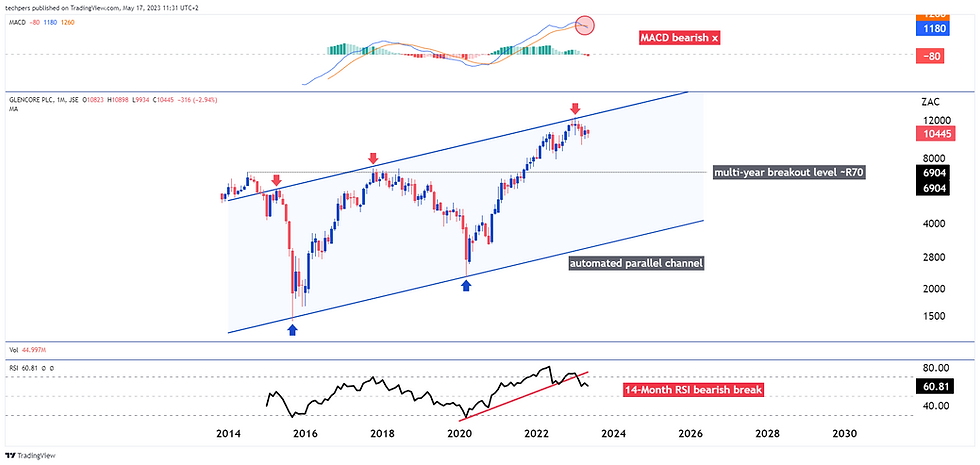
Over the long term, SSW has lost significant market value (from R50 to R14), while GLN has gradually drifted lower (from R105 to near R84)
Both of the original charts are shown below:
GLN Monthly Chart (17 May 2023)
SSW Monthly Chart (11 September 2021) - 3 Years Ago Today!
Was R50 now R14!
Are using monthly charts to help identify risks and opportunities?
Let us help you do that!
Lester Davids
Analyst: Unum Capital


Comments