
Buyer/Seller Dominance + Technical Summary
- Lester Davids
- Apr 19, 2024
- 1 min read
Updated: May 3, 2024
READING TIME: 1 MINUTE | PRE-MARKET | LAST UPDATE: END OF DAY FRIDAY, 03 MAY 2024
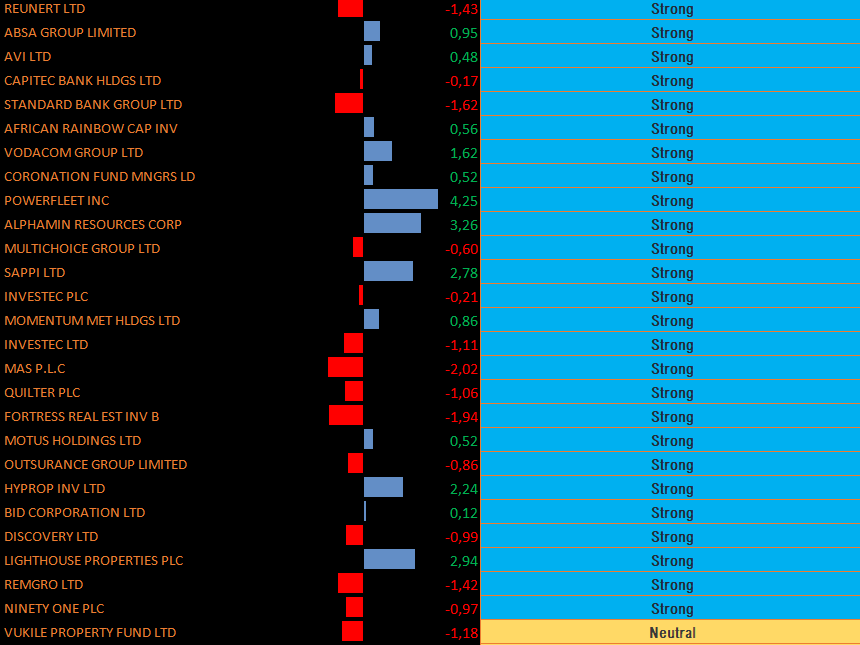
THIS TABLE SHOWS WHERE BUYERS/SELLERS HAVE BEEN THE MOST DOMINANT.
Candlestick Formations (Buyer/Seller Dominance) form part of technical price charts, which are are used by market participants to interpret current demand-supply dynamics, potential price trends as well as form decisions from these inferences. The tables below highlight the following: (1) The share name (2) the candle's 'change from open’ (over 1 session) i.e. from the start of the first hour of the trading day to the end of the last hour of the trading day'. This is used to determine the strength/weakness of the candle formation i.e. the greater (+) the percentage, the stronger the candle formation and the weaker (-) the percentage, the weaker the candle formation and (3) the share's short term technical rating i.e. which phase the share is in over a 7 day period.
END OF DAY
DAILY: SORTED BY MOST OVERBOUGHT TO LEAST OVERBOUGHT (SHORT TERM)


Related Post: https://www.unum.capital/post/tactical-trading-guide
Lester Davids
Analyst: Unum Capital
Comments