top of page


Understanding Relative Price Strength (RPS) in Share Trading
Introduction: Relative Price Strength (RPS) is a critical technical indicator used by traders and investors to assess the performance of...
Peet Serfontein
Jun 6, 2024
8
0
Understanding Relative Price Strength (RPS) in Share Trading
Introduction: Relative Price Strength (RPS) is a critical technical indicator used by traders and investors to assess the performance of...
Peet Serfontein
Jun 5, 2024
0
0
Understanding Relative Price Strength (RPS) in Share Trading
Introduction: Relative Price Strength (RPS) is a critical technical indicator used by traders and investors to assess the performance of...
Peet Serfontein
May 28, 2024
0
0


Value Traded to the Daily Average Value traded for JSE shares
What is a Heatmap? This heatmap displays value trader data regarding the top 60 JSE (Johannesburg Stock Exchange) shares. It depicts how...
Peet Serfontein
May 28, 2024
0
0


Understanding Relative Rotational Graph (RRG) in Share Trading
Introduction In the world of equity market analysis, traders and investors often seek to identify promising investment opportunities by...
Peet Serfontein
May 27, 2024
1
0
Understanding Relative Price Strength (RPS) in Share Trading
Introduction: Relative Price Strength (RPS) is a critical technical indicator used by traders and investors to assess the performance of...
Peet Serfontein
May 27, 2024
0
0
Understanding Relative Rotational Graph (RRG) in Share Trading
Introduction In the world of equity market analysis, traders and investors often seek to identify promising investment opportunities by...
Peet Serfontein
May 21, 2024
4
0
Understanding Relative Price Strength (RPS) in Share Trading
Introduction: Relative Price Strength (RPS) is a critical technical indicator used by traders and investors to assess the performance of...
Peet Serfontein
May 21, 2024
0
0
Understanding Relative Rotational Graph (RRG) in Share Trading
Introduction In the world of equity market analysis, traders and investors often seek to identify promising investment opportunities by...
Peet Serfontein
May 20, 2024
4
0


Understanding Relative Price Strength (RPS) in Share Trading
Introduction: Relative Price Strength (RPS) is a critical technical indicator used by traders and investors to assess the performance of...
Peet Serfontein
May 15, 2024
1
0
Understanding Relative Rotational Graph (RRG) in Share Trading
Introduction In the world of equity market analysis, traders and investors often seek to identify promising investment opportunities by...
Peet Serfontein
May 14, 2024
1
0
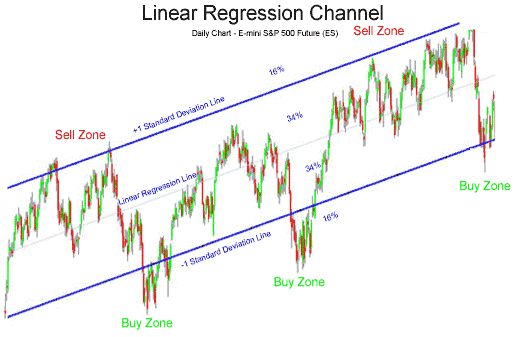
Understanding Linear Regression Channels and Standard Deviation in Price Action Analysis
Introduction In the world of technical analysis, traders and investors often use various tools and indicators to gain insights into...
Peet Serfontein
May 13, 2024
5
0


Understanding Beta: A Key Metric for Share Investors
Introduction When it comes to investing in shares, it's crucial to be armed with the right tools and knowledge to make informed...
Peet Serfontein
May 10, 2024
0
0
Understanding Relative Rotational Graph (RRG) in Share Trading
Introduction In the world of equity market analysis, traders and investors often seek to identify promising investment opportunities by...
Peet Serfontein
May 10, 2024
1
0
Understanding Relative Price Strength (RPS) in Share Trading
Introduction: Relative Price Strength (RPS) is a critical technical indicator used by traders and investors to assess the performance of...
Peet Serfontein
May 8, 2024
1
0
Understanding Relative Price Strength (RPS) in Share Trading
Introduction: Relative Price Strength (RPS) is a critical technical indicator used by traders and investors to assess the performance of...
Peet Serfontein
May 6, 2024
0
0
Understanding Relative Price Strength (RPS) in Share Trading
Introduction: Relative Price Strength (RPS) is a critical technical indicator used by traders and investors to assess the performance of...
Peet Serfontein
May 2, 2024
2
0


JSE Volume Analysis
Introduction: This graph is a scatter plot presenting volume analysis for the Johannesburg Stock Exchange (JSE). The horizontal axis...
Peet Serfontein
May 2, 2024
0
0
Understanding Relative Rotational Graph (RRG) in Share Trading
Introduction In the world of equity market analysis, traders and investors often seek to identify promising investment opportunities by...
Peet Serfontein
Apr 30, 2024
3
0


Understanding Relative Rotational Graph (RRG) in Share Trading
Introduction In the world of equity market analysis, traders and investors often seek to identify promising investment opportunities by...
Peet Serfontein
Apr 24, 2024
7
0

Your Profit Partner
bottom of page